This is definitely a tougher blog post to write. I don’t want to bore my fellow math-inclined peers with simple definitions, and I don’t want to bore the others with technical details from my proofs. So I guess I’ll start by throwing out a link to the actual pdf of my blog post here (for those of you willing to wade through all 29 pages). I’ll restrict this blog post to describing the Stochastic Block Model, my variation of this model, the results on known datasets, and a general discussion on potential further work and generalizability of my variant.
Some Background on SBMs
First, what is a Stochastic Block Model (SBM)? The term and mathematical notation was first defined in 1983 in some paper by some random ivy league stats professor named Paul Holland. He wanted a mathematical way of describing and generating an n-cluster graph (if you need a quick refresher on graphs you can refer back to this post.
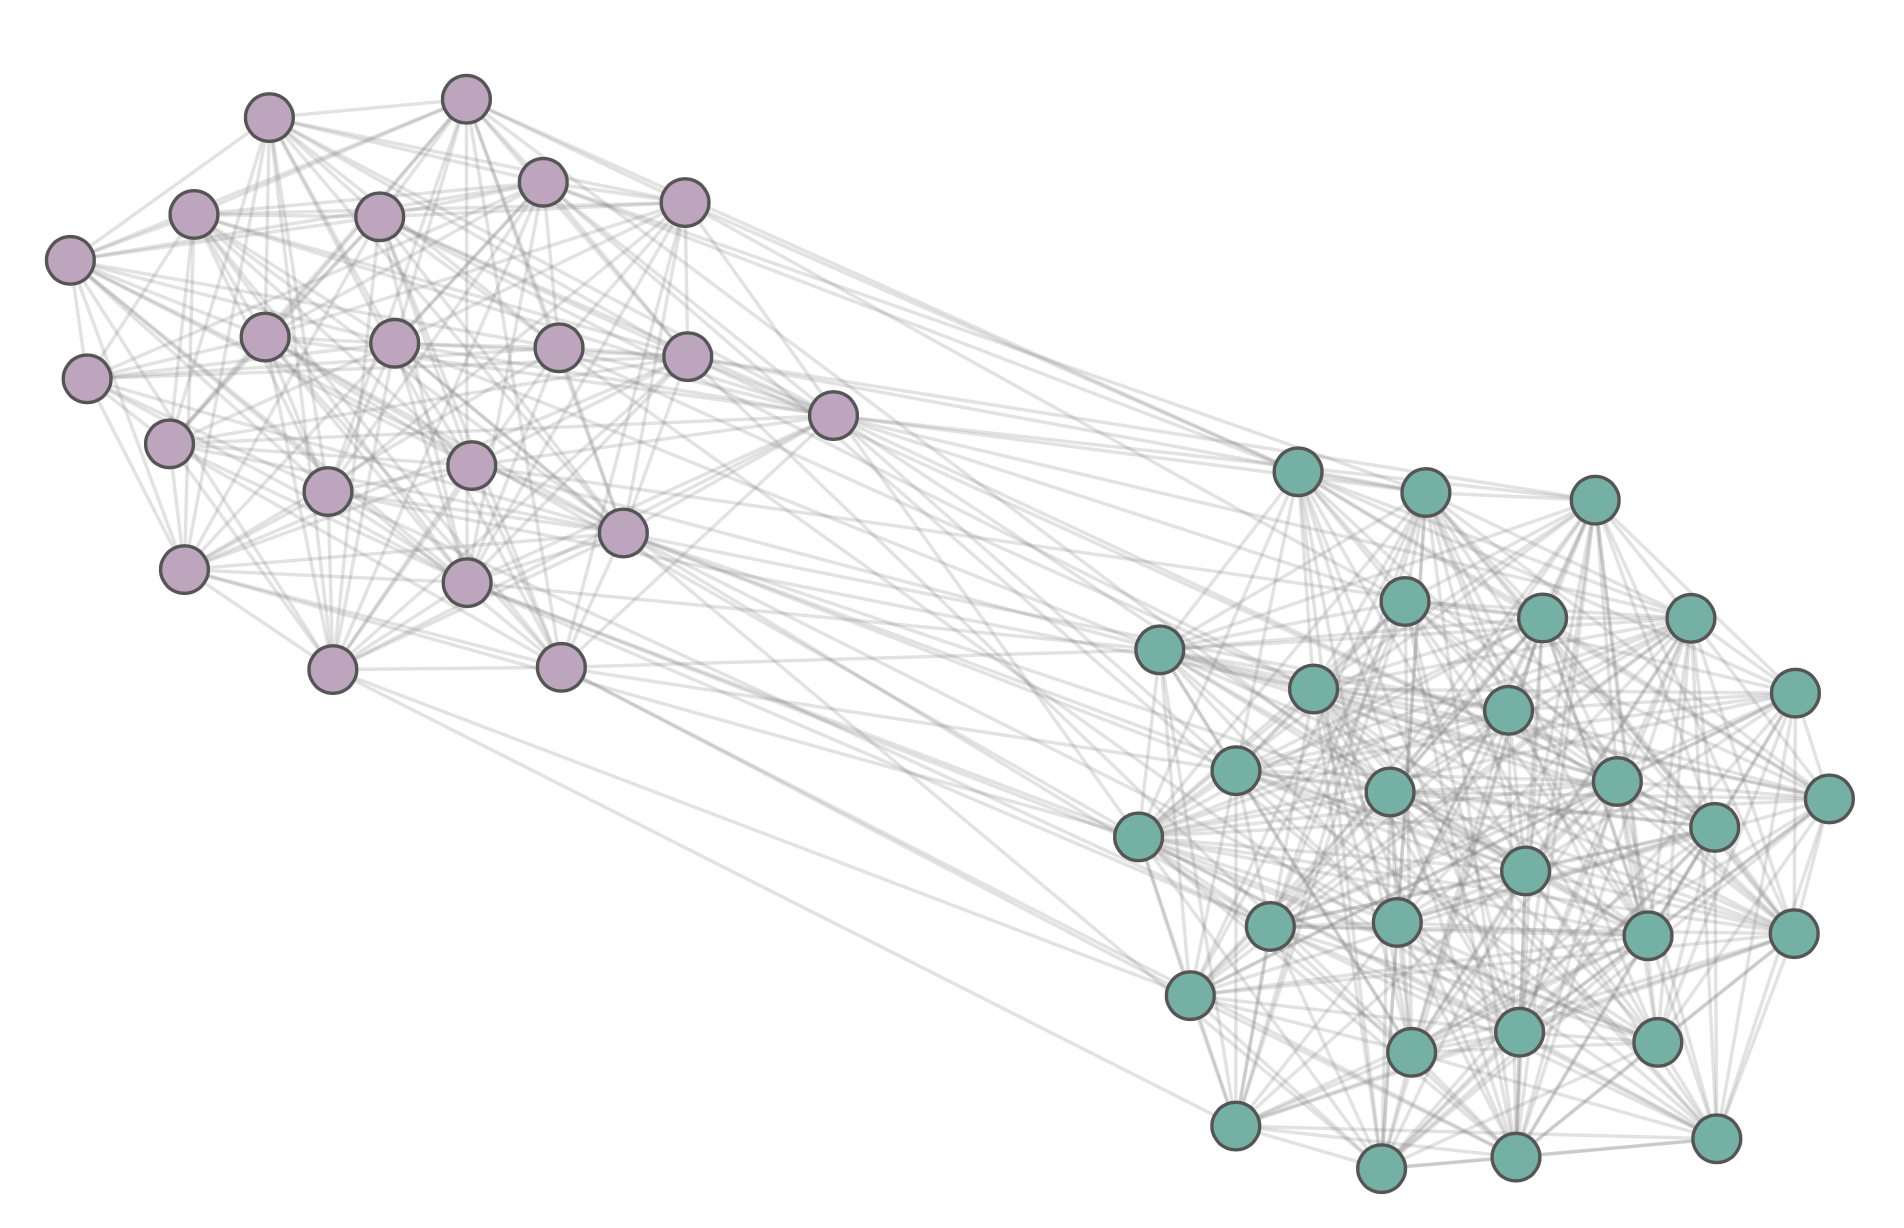
Here is an example of a simple SBM. You have two friend-groups: the Crips and the Bloods. The Bloods are a very tight-night community and each Blood is friends with another Blood with 90% probability. On the other hand, there are a lot more Crips and they don’t know each other as well. The probability that a Crip is friends with another Crip is only 10%. The probability that any Crip is friends with any Blood is very rare: only 2%.
Now let’s say that you don’t know which person is a Crip and which person is a Blood. All you know is the graph; i.e. you only know all the pairs of friends. The goal is to now label each person such that you correctly partition the group of Crips and Bloods. This problem is known as SBM Recovery. In SBM Recovery, we assume that a given graph is the result of an SBM where you have a random sample of nodes from various populations and the probability of an edge between two nodes a and b comes from the probability p of an edge between their respective populations. A graph is SBM recoverable if we can properly partition the populations with high probability.
There are certain interesting results that come from examining even the simplest SBMs. You can show that if the probability of an edge between two populations A and B is close enough to the probability of an edge within the populations, then you can not obtain an exact SBM recovery.
My Variant of SBMs
Simple SBMs have a lot of applications currently in physics, public health, and other statistical modeling. However, one drawback I noticed is that it doesn’t allow for the flexibility of labeling nodes that could exist on a continuous spectrum. One classic example of that is the social network modeling of people with beliefs that range on the continuous spectrum from liberal to conservative. A common model is one which shows that people who are close to the ends of the spectrum don’t associate much with any group but each other while those who are in the center have some probability of associating with either extreme. Proponents of regular SBMs will claim: why not just add more stratification among population labels? That solution ends up being ugly and doesn’t work when the total number of nodes n isn’t that large.
My idea was fairly simple. Why not instead try to label nodes with a fixed number k of continuous labels. Then we can apply a bounded normalization function to the dot product of any two label vectors and obtain a probability p of an edge between any two nodes.
You might ask, “Ughhh Josh, if we are trying to learn/recover so many vectors of continuous features, how can you be sure that you aren’t overfitting?” For the answer to that question, you should look to Theorem 2 of my paper. I bound the error between the predicted transition matrix X’ and the true transition matrix X. The proof ends up being a lot of inequality bashing and takes advantage of a symmetrization argument.
Results on Various Datasets
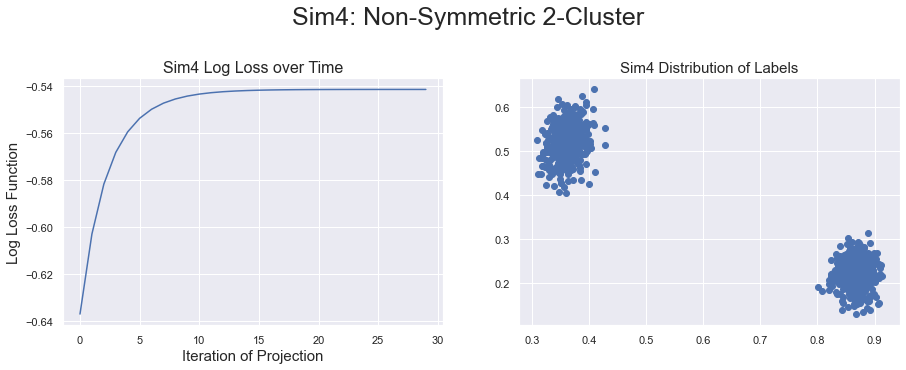
Results were very positive and straightforward on the synthetic SBM models that I generated to test the Continuous SBM variant. When inter-cluster probabilities were significantly smaller than intra-cluster probabilities, the labels we generated had two distinct clusters
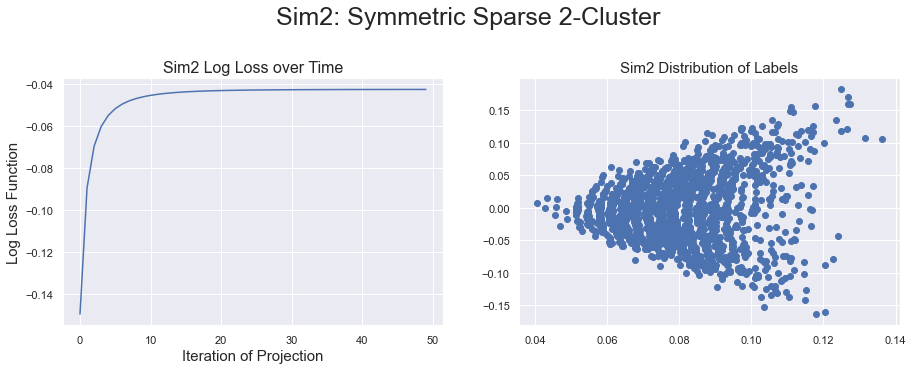
On the other hand, if the probabilities ran close together, then the continuous labels could not be separated into two clusters.
When I was looking at real-life datasets, we had some more interesting results. A cool one was when I looked at the continuous labelings of political blog posts. The underlying graph here has “edges” between blogs that reference other blogs.
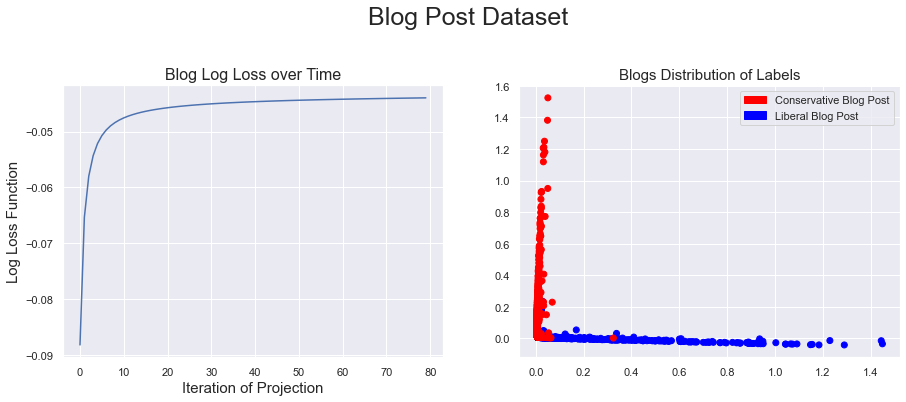
I was happy to see that the partition of the labels seemed in line with the “true labels.” However, one somewhat interesting (and sobering) result that came from this dataset is that almost all conservative and liberal blogs were completely orthogonal to each other. This means the probability of an edge between any two political opposites is almost always 0. This dataset indicates a very low level of interaction between the conservative and liberal communities.
Some Further Discussion
My initial approach to model continuous labels was to try and recover a singular set of labels as well as a generalized function f such that f(a,b) would output the probability p of an edge between a and b. I thought this approach would have the best trade-off between overfit and generalizability. I quickly realized that most simple classes of function f would not be able to recover even an arbitrary 3-cluster SBM. On the other hand, the method of having k labels lends nicely to recovering any Continuous SBM that was generated by a polynomial f with fixed degree d (Proposition 3 in my paper).
Something that I would like to explore further is a rigorous proof that the labels I recover from a simple SBM-generated graph end up clustering if and only if the SBM has an exact (or almost-exact) recovery. I think this would be super cool because it also has important ramifications on which arbitrary datasets can be clustered properly. I can achieve weak bounds following directly from Theorem 2, but I’m not sure if it leads to any meaningful discussion. Alas, I didn’t have enough time to fully explore that direction. I hope you enjoyed this quick overview of the topic, and please let me know if there are things that weren’t very clear (I go into much further detail in the paper itself).